Manipulate PIMH objects.
Source:R/pimh.r
Manipulate PIMH objects.
The method biips_pimh_update performs burn-in iterations for the PIMH
algorithm.
The method biips_pimh_samples performs iterations for the PIMH
algorithm and returns samples.
is.pimh(object)

# S3 method for pimh
biips_pimh_update(object, n_iter, n_part, thin = 1,
  output = "l", ...)

# S3 method for pimh
biips_pimh_samples(object, n_iter, n_part, thin = 1,
  output = "l", ...)
Arguments
| object | a |
|---|---|
| n_iter | integer. Number of burn-in iterations. |
| n_part | integer. Number of particles used in SMC algorithms. |
| thin | integer. Thinning interval. Returns samples every |
| output | string. Select additional members to be returned in the
|
| ... | Additional arguments to be passed to the SMC
algorithm such as |
Value
The function is.pimh returns TRUE if the object is of
class pimh.
The methods biips_pimh_update and biips_pimh_update
return an object of class mcmcarray.list.
biips_pimh_samples output contains one mcmcarray
member for each monitored variable returned by the variable_names()
member function of the pimh object.
If the output argument is not empty, the output contains
additional members. See details.
The members of the mcmcarray.list object are
mcmcarray objects for different variables. Assuming dim
is the dimension of the monitored variable, the mcmcarray
object is an array of dimension c(dim, n_iter) with the following
attributes (accessible with attr):
- name
string with the name of the variable.
- lower
vector with the lower bounds of the variable.
- upper
vector with the upper bounds of the variable.
Details
The output string arguments can be used to query additional
members in the mcmcarray.list output. If output
contains:
- l
returns member
log_marg_like.mcmcarraywith log marginal likelihood estimates over iterations.- a
returns member
info$accept_rate.mcmcarraywith acceptance rate over iterations.
See also
Examples
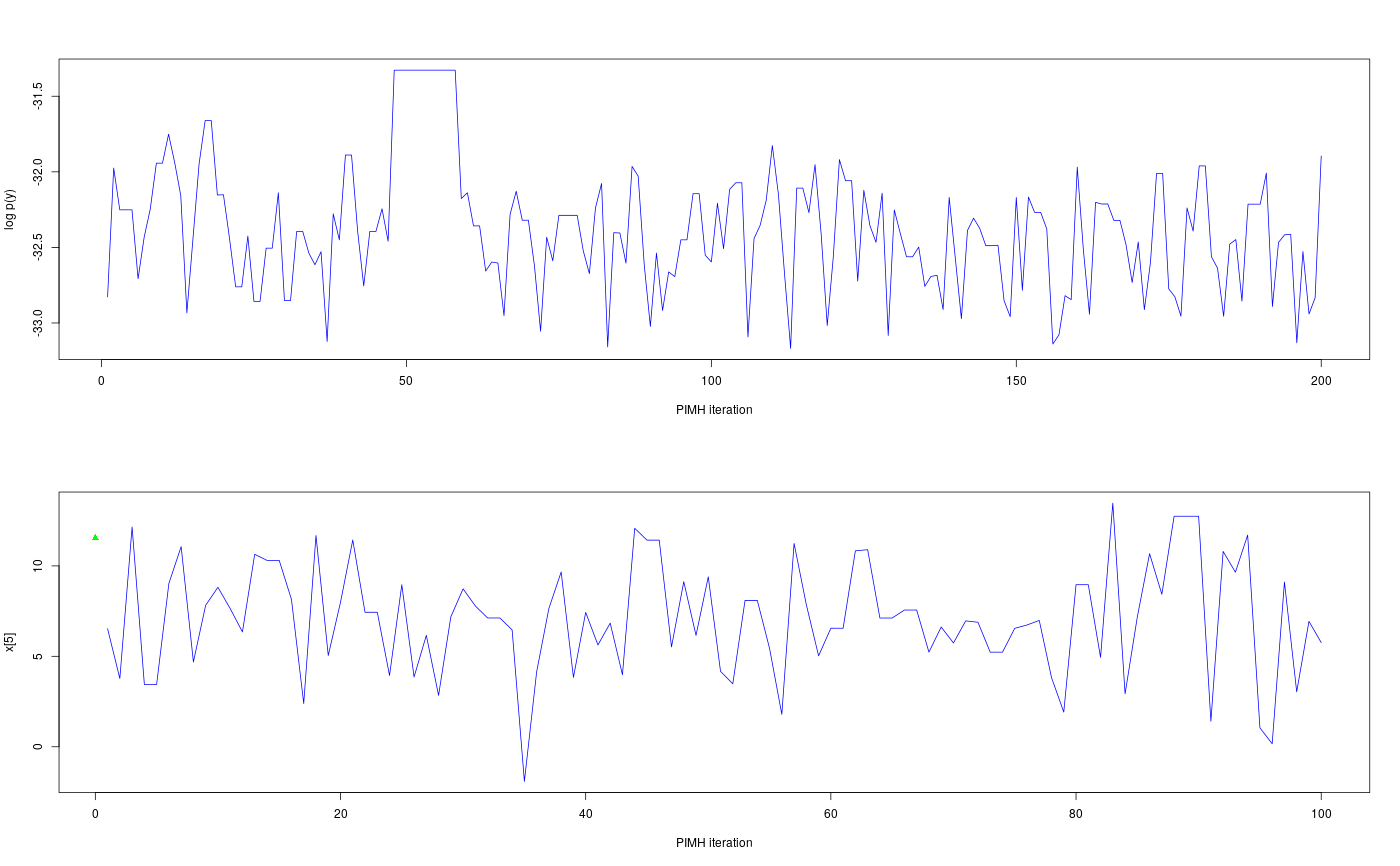
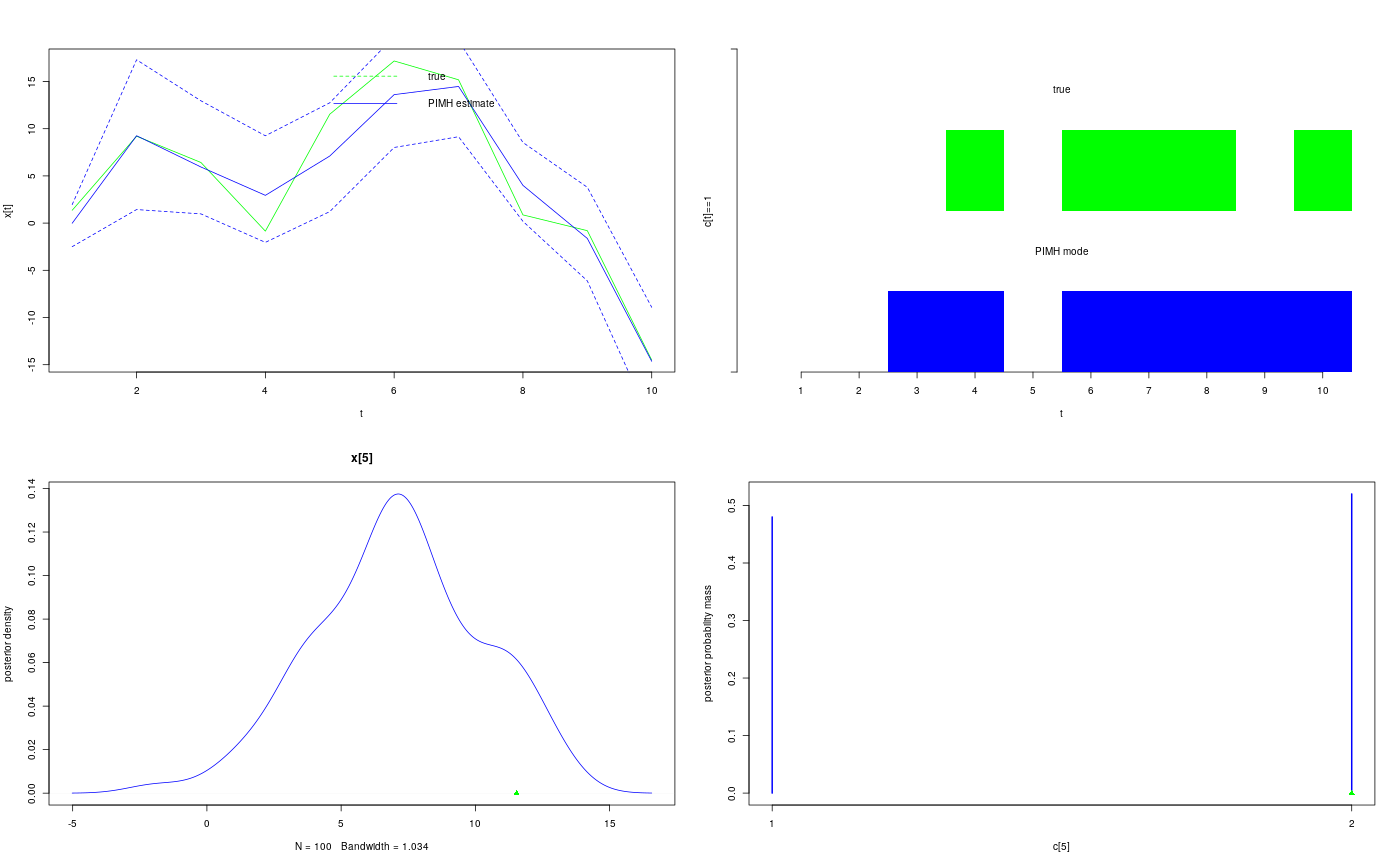
modelfile <- system.file('extdata', 'hmm.bug', package = 'rbiips') stopifnot(nchar(modelfile) > 0) cat(readLines(modelfile), sep = '\n')#> var c_true[tmax], x_true[tmax], c[tmax], x[tmax], y[tmax] #> #> data #> { #> x_true[1] ~ dnorm(0, 1/5) #> y[1] ~ dnorm(x_true[1], exp(logtau_true)) #> for (t in 2:tmax) #> { #> c_true[t] ~ dcat(p) #> x_true[t] ~ dnorm(0.5*x_true[t-1]+25*x_true[t-1]/(1+x_true[t-1]^2)+8*cos(1.2*(t-1)), ifelse(c_true[t]==1, 1/10, 1/100)) #> y[t] ~ dnorm(x_true[t]/4, exp(logtau_true)) #> } #> } #> #> model #> { #> logtau ~ dunif(-3, 3) #> x[1] ~ dnorm(0, 1/5) #> y[1] ~ dnorm(x[1], exp(logtau)) #> for (t in 2:tmax) #> { #> c[t] ~ dcat(p) #> x[t] ~ dnorm(0.5*x[t-1]+25*x[t-1]/(1+x[t-1]^2)+8*cos(1.2*(t-1)), ifelse(c[t]==1, 1/10, 1/100)) #> y[t] ~ dnorm(x[t]/4, exp(logtau)) #> } #> }data <- list(tmax = 10, p = c(.5, .5), logtau_true = log(1), logtau = log(1)) model <- biips_model(modelfile, data)#> * Parsing model in: /home/adrien/Dropbox/workspace/rbiips/inst/extdata/hmm.bug #> * Compiling data graph #> Declaring variables #> Resolving undeclared variables #> Allocating nodes #> Graph size: 169 #> Sampling data #> Reading data back into data table #> * Compiling model graph #> Declaring variables #> Resolving undeclared variables #> Allocating nodes #> Graph size: 180#> * Initializing PIMHis.pimh(obj_pimh)#> [1] TRUEout_pimh_burn <- biips_pimh_update(obj_pimh, 100, n_part) # Burn-in#> * Updating PIMH with 50 particles #> |--------------------------------------------------| 100% #> |**************************************************| 100 iterations in 0.25 sout_pimh <- biips_pimh_samples(obj_pimh, 100, n_part) # Samples#> * Generating PIMH samples with 50 particles #> |--------------------------------------------------| 100% #> |**************************************************| 100 iterations in 0.26 ssumm_pimh_x <- biips_summary(out_pimh$x, order = 2, probs = c(0.025, 0.975)) dens_pimh_x <- biips_density(out_pimh$x) summ_pimh_c <- biips_summary(out_pimh[['c[2:10]']]) table_pimh_c <- biips_table(out_pimh[['c[2:10]']]) par(mfrow = c(2, 1)) plot(c(out_pimh_burn$log_marg_like, out_pimh$log_marg_like), type = 'l', col = 'blue', xlab = 'PIMH iteration', ylab = 'log p(y)') t <- 5 plot(out_pimh$x[t, ], type = 'l', col = 'blue', xlab = 'PIMH iteration', ylab = paste0('x[',t,']'))points(0, model$data()$x_true[t], pch = 17, col = 'green')par(mfrow = c(2, 2)) plot(model$data()$x_true, type = 'l', col = 'green', xlab = 't', ylab = 'x[t]') lines(summ_pimh_x$mean, col = 'blue') matlines(matrix(unlist(summ_pimh_x$quant), data$tmax), lty = 2, col = 'blue') legend('topright', leg = c('true', 'PIMH estimate'), lty = c(2, 1), col = c('green', 'blue'), bty = 'n') barplot(.5*(model$data()$c_true==1), col = 'green', border = NA, space = 0, offset = 1, ylim=c(0,2), xlab='t', ylab='c[t]==1', axes = FALSE) axis(1, at=1:data$tmax-.5, labels=1:data$tmax) axis(2, line = 1, at=c(0,2), labels=NA) text(data$tmax/2, 1.75, 'true') barplot(.5*c(NA, summ_pimh_c$mode==1), col = 'blue', border = NA, space = 0, axes = FALSE, add = TRUE) text(data$tmax/2, .75, 'PIMH mode') plot(dens_pimh_x[[t]], col='blue', main = , ylab = 'posterior density') points(model$data()$x_true[t], 0, pch = 17, col = 'green') plot(table_pimh_c[[t-1]], col='blue', ylab = 'posterior probability mass')points(model$data()$c_true[t], 0, pch = 17, col = 'green')