Matbiips example: Stochastic kinetic predator-prey model
Reference: R.J. Boys, D.J. Wilkinson and T.B.L. Kirkwood. Bayesian inference for a discretely observed stochastic kinetic model. Statistics and Computing (2008) 18:125-135.
Contents
Statistical model
The continuous-time Lotka-Volterra Markov jump process describes the evolution of two species  (prey) and
  (predator) at time
  . Let
. Let  be an infinitesimal interval. The process evolves as


where  ,
,  and
and  .
.
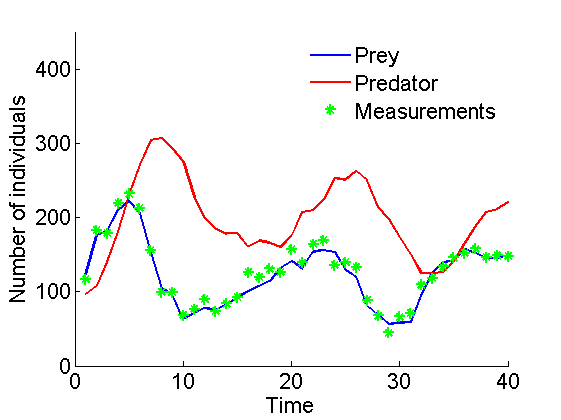
Forward simulation can be done using the Gillespie algorithm. We additionally assume that we observe at some time  the number of preys with some noise

Statistical model in BUGS language
Content of the file 'stoch_kinetic_gill.bug':
model_file = 'stoch_kinetic_gill.bug'; % BUGS model filename
type(model_file);
# Stochastic kinetic predator-prey model
# cf Boys, Wilkinson and Kirkwood
# Bayesian inference for a discretely observed stochastic kinetic model

var x_true[2,t_max], x[2,t_max], y[t_max], c[3]

data
{
  x_true[,1] ~ LV(x_init,c[1],c[2],c[3],1)
  y[1] ~ dnorm(x_true[1,1], 1/sigma^2)
  for (t in 2:t_max)
  {
    x_true[1:2, t] ~ LV(x_true[1:2,t-1],c[1],c[2],c[3],1)
    y[t] ~ dnorm(x_true[1,t], 1/sigma^2)
  }
}

model
{
  x[,1] ~ LV(x_init,c[1],c[2],c[3],1)
  y[1] ~ dnorm(x[1,1], 1/sigma^2)
  for (t in 2:t_max)
  {
    x[,t] ~ LV(x[,t-1],c[1],c[2],c[3],1)
    y[t] ~ dnorm(x[1,t], 1/sigma^2)
  }
}
User-defined Matlab functions
Content of the Matlab file 'lotka_volterra_gillepsie.m':
type('lotka_volterra_gillespie.m');
function x = lotka_volterra_gillespie(x, c1, c2, c3, dt)

% Simulation from a Lotka-Volterra model with the Gillepsie algorithm
% x1 is the number of prey
% x2 is the number of predator
% R1: (x1,x2) -> (x1+1,x2)      At rate c1x1
% R2: (x1,x2) -> (x1-1,x2+1)    At rate c2x1x2
% R3: (x1,x2) -> (x1,x2-1)      At rate c3xx2

z = [1, -1, 0;
    0, 1, -1];

t = 0;
while true
    rate = [c1*x(1), c2*x(1)*x(2), c3*x(2)];
    sum_rate = sum(rate);
    t = t - log(rand)/sum_rate; % Sample next event from an exponential distribution
    ind = find((sum_rate*rand)<=cumsum(rate), 1); % Sample the type of event
    if t>dt
        break
    end
    x = x + z(:, ind);
end
Content of the Matlab file 'lotka_volterra_dim.m':
type('lotka_volterra_dim.m');
function out_dim = f_dim(x_dim, c1_dim, c2_dim, c3_dim, dt_dim)

out_dim = [2,1];
Installation of Matbiips
- Download the latest version of Matbiips
- Unzip the archive in some folder
- Add the Matbiips folder to the Matlab search path
matbiips_path = '../../matbiips';
addpath(matbiips_path)
General settings
set(0, 'DefaultAxesFontsize', 16);
set(0, 'Defaultlinelinewidth', 2);
set(0, 'DefaultLineMarkerSize', 8);
light_blue = [.7, .7, 1];
light_red = [1, .7, .7];
dark_blue = [0, 0, .5];
dark_red = [.5, 0, 0];

% Set the random numbers generator seed for reproducibility
if isoctave() || verLessThan('matlab', '7.12')
    rand('state', 0)
else
    rng('default')
end
Add new sampler to Biips
Add the user-defined function 'LV' to simulate from the Lotka-Volterra model
fun_bugs = 'LV'; fun_nb_inputs = 5;
fun_dim = 'lotka_volterra_dim'; fun_sample = 'lotka_volterra_gillespie';
biips_add_distribution(fun_bugs, fun_nb_inputs, fun_dim, fun_sample);
* Added distribution 'LV'
Load model and data
Model parameters
t_max = 40;
x_init = [100; 100];
c = [.5, .0025, .3];
sigma = 10;
data = struct('t_max', t_max, 'c', c, 'x_init', x_init, 'sigma', sigma);
Compile BUGS model and sample data
sample_data = true; % Boolean
model = biips_model(model_file, data, 'sample_data', sample_data); % Create Biips model and sample data
data = model.data;
* Parsing model in: stoch_kinetic_gill.bug
* Compiling data graph
  Declaring variables
  Resolving undeclared variables
  Allocating nodes
  Graph size: 131
  Sampling data
  Reading data back into data table
* Compiling model graph
  Declaring variables
  Resolving undeclared variables
  Allocating nodes
  Graph size: 132
Plot data
figure('name', 'Data')
plot(1:t_max, data.x_true(1,:))
hold on
plot(1:t_max, data.x_true(2,:), 'r')
plot(1:t_max, data.y, 'g*')
xlabel('Time')
ylabel('Number of individuals')
legend('Prey', 'Predator', 'Measurements')
legend boxoff
box off
ylim([0, 450])
saveas(gca, 'kinetic_data', 'epsc2')
saveas(gca, 'kinetic_data', 'png')

Biips Sequential Monte Carlo algorithm
Run SMC
n_part = 10000; % Number of particles
variables = {'x'}; % Variables to be monitored
out_smc = biips_smc_samples(model, variables, n_part, 'type', 'fs');

summ_smc = biips_summary(out_smc, 'probs', [.025, .975]);
* Assigning node samplers
* Running SMC forward sampler with 10000 particles
  |--------------------------------------------------| 100%
  |**************************************************| 40 iterations in 394.67 s
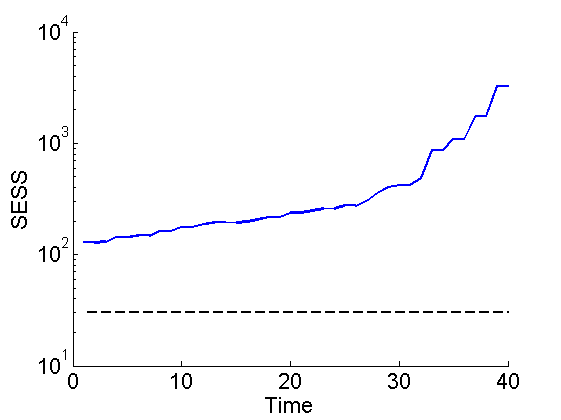
Smoothing ESS
figure('name', 'SMC: SESS')
semilogy(1:t_max, out_smc.x.s.ess(1,:))
hold on
plot(1:t_max, 30*ones(t_max, 1), 'k--')
xlabel('Time')
ylabel('SESS')
box off
ylim([10, n_part])
saveas(gca, 'kinetic_sess', 'epsc2')
saveas(gca, 'kinetic_sess', 'png')

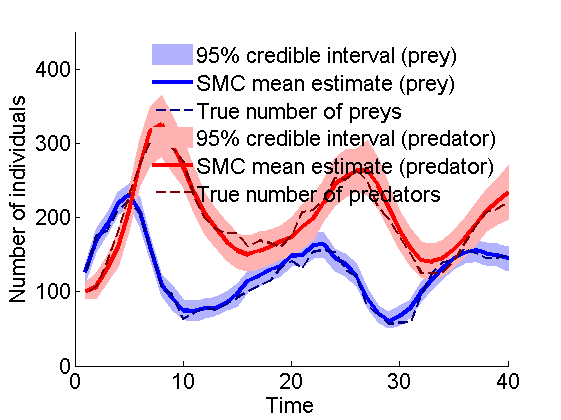
Posterior mean and quantiles for x
figure('name', 'SMC: Posterior mean and quantiles')
x_smc_mean = summ_smc.x.s.mean;
x_smc_quant = summ_smc.x.s.quant;
h = fill([1:t_max, t_max:-1:1], [x_smc_quant{1}(1,:), fliplr(x_smc_quant{2}(1,:))], 0);
set(h, 'edgecolor', 'none', 'facecolor', light_blue)
hold on
plot(1:t_max, x_smc_mean(1, :), 'linewidth', 3)
plot(1:t_max, data.x_true(1,:), '--', 'color', dark_blue)
h = fill([1:t_max, t_max:-1:1], [x_smc_quant{1}(2,:), fliplr(x_smc_quant{2}(2,:))], 0);
set(h, 'edgecolor', 'none', 'facecolor', light_red)
plot(1:t_max, x_smc_mean(2, :), 'r', 'linewidth', 3)
plot(1:t_max, data.x_true(2,:), '--', 'color', dark_red)
xlabel('Time')
ylabel('Number of individuals')
ylim([0, 450])
legend({'95% credible interval (prey)', 'SMC mean estimate (prey)', 'True number of preys',...
    '95% credible interval (predator)', 'SMC mean estimate (predator)',...
    'True number of predators'})
legend boxoff
box off
saveas(gca, 'kinetic_smc', 'epsc2')
saveas(gca, 'kinetic_smc', 'png')

Clear model
biips_clear(model)